

Visual Strategy Builder
Create any strategy.Control every detail.
A fully visual workflow that adapts to simple ideas, complex systems, and everything in between.
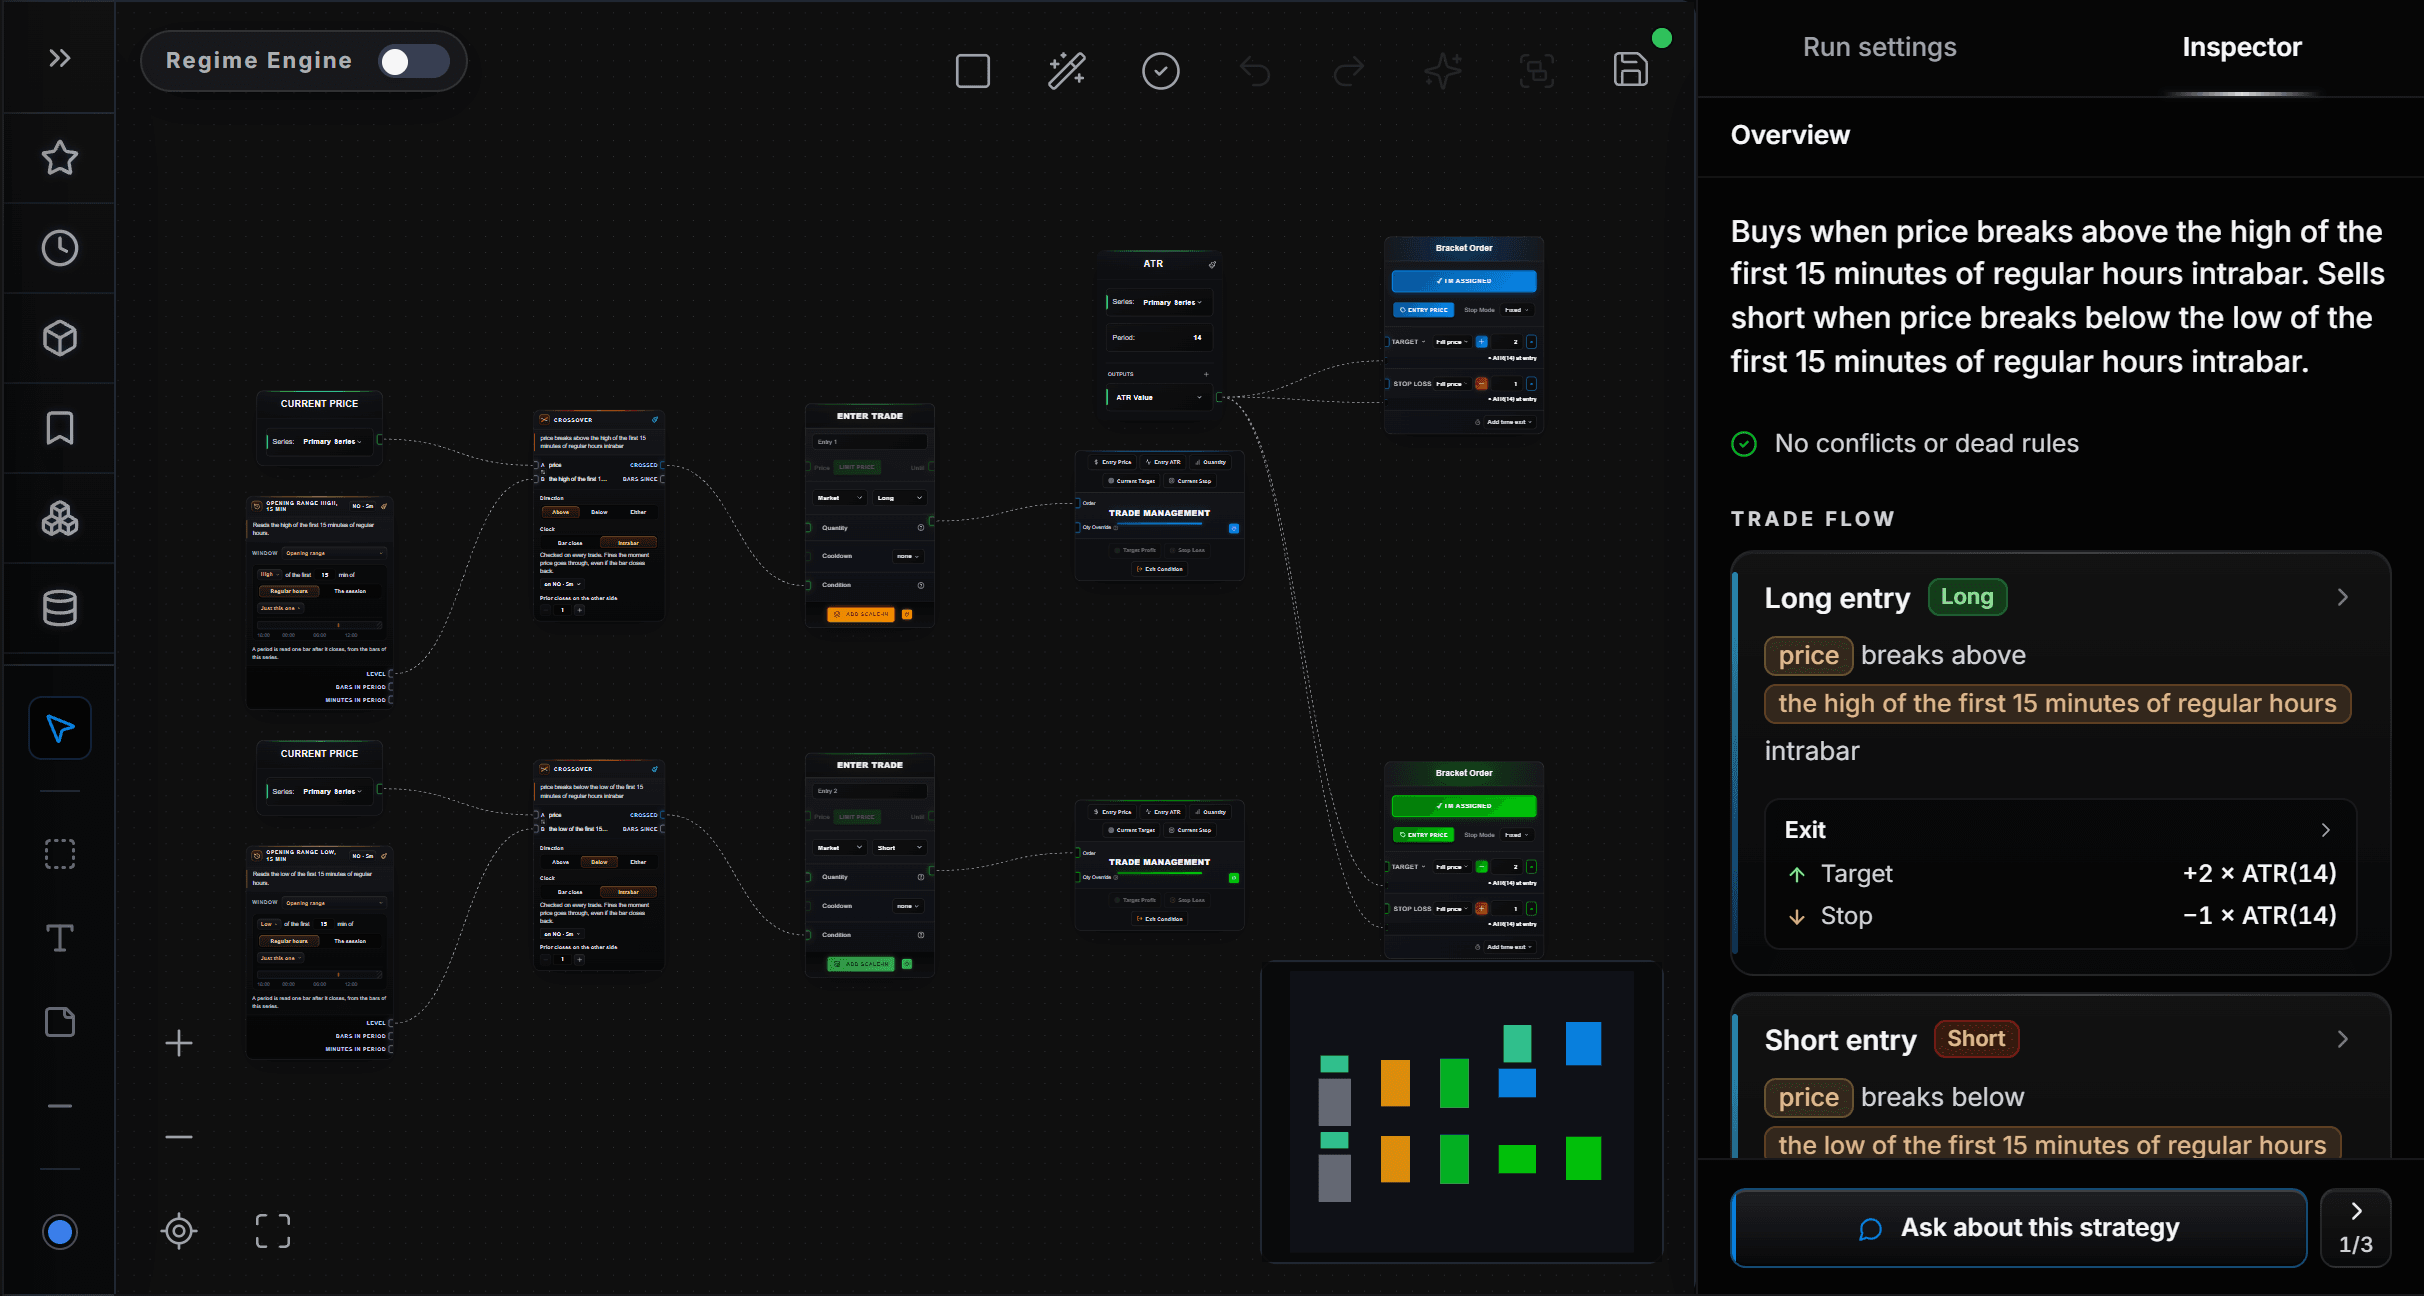
Know what you built before you spend a credit.
Every entry, exit and limit reads as a sentence whose terms link back to their blocks on the canvas. Hover one and its node lights up; change a number and the meters recount on the same bars the engine uses.
Conflicts and impossible combinations are flagged as you build, so a run never fails on something a glance would catch.
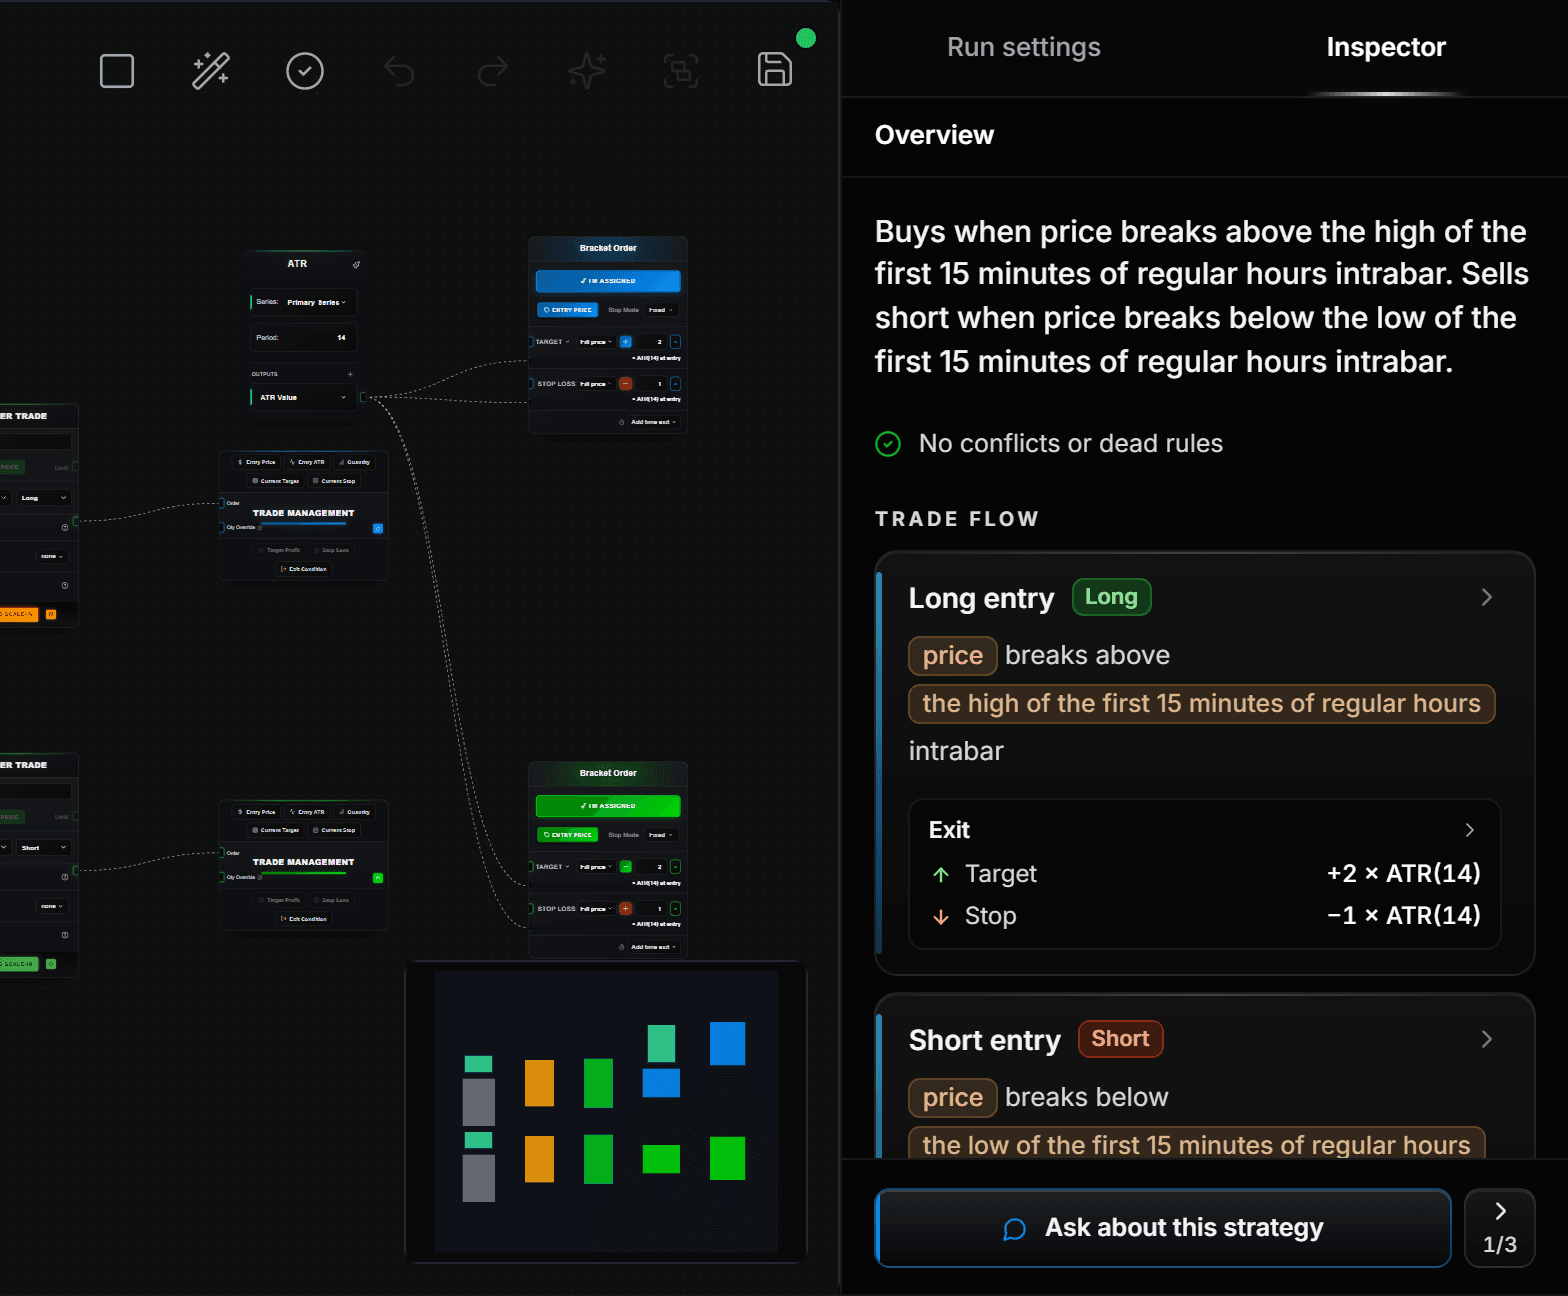
Indicators and price action, each one shown on real bars.
77 indicators across moving averages, oscillators, trend, volatility and volume, and 9 price-action tools for structure, candles and channels: swing points, market structure, order blocks, fair value gaps, trend and Raff channels.
18 external series sit beside them: company fundamentals and earnings, macro rates and readings, news sentiment and dividends.

The parts traders actually mean, as single blocks.
- Time
- Time windows by session, weekday and clock; time since an entry or a losing exit; cooldowns; exits at a time of day.
- Levels
- Price History for any high, low or close over a window or session, pivot levels, opening ranges, bands around a center.
- Events
- Crossovers that fire once, at the bar close or the moment price goes through, and event days on the calendar.
- Memory
- Since and Capture remember when a condition last held and what price was then. A state machine holds a pattern with stages, such as a second push above a swing high.
- Regimes
- Detect the market's state, then run a different strategy in each, with rules for how to switch.
- Orders
- Bracket orders with a target and a stop, trailing stops, a daily trade limit and a time exit.