

Backtests that replay the tape, not the candles.
Every run replays the market one trade print at a time, so the order of events inside a bar is the order they happened in. Years of history come back in minutes, with every trade on the chart and every number explained.
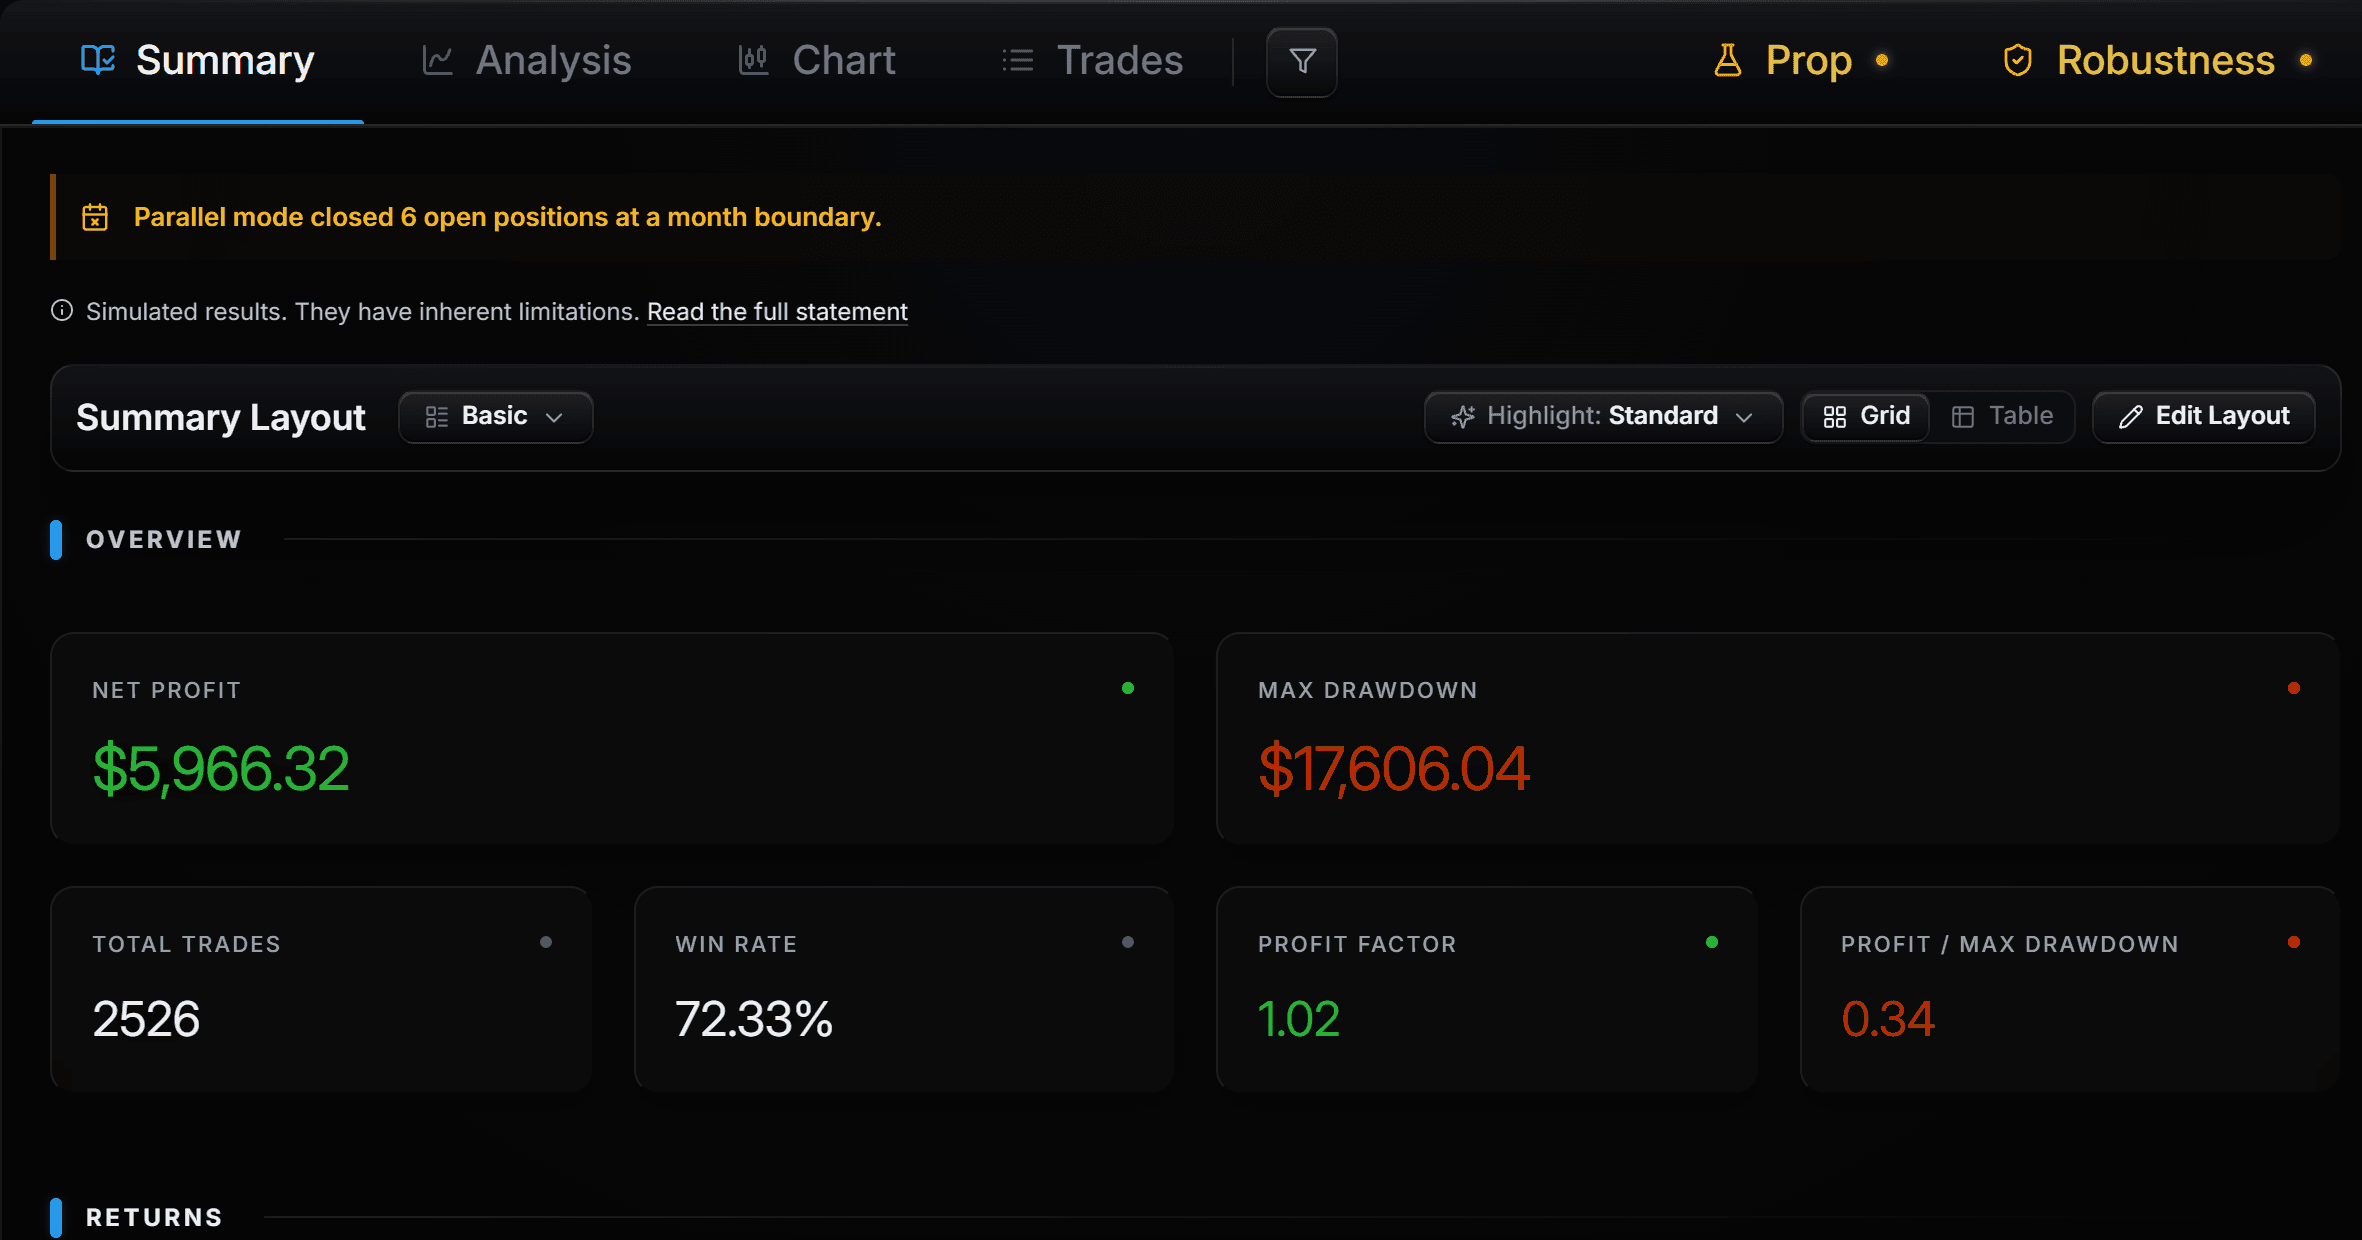
Simulated results. They have inherent limitations. Read the full statementHide the statement
These results are based on simulated or hypothetical performance results that have certain inherent limitations. Unlike the results shown in an actual performance record, these results do not represent actual trading. Also, because these trades have not actually been executed, these results may have under-or over-compensated for the impact, if any, of certain market factors, such as lack of liquidity. Simulated or hypothetical trading programs in general are also subject to the fact that they are designed with the benefit of hindsight. No representation is being made that any account will or is likely to achieve profits or losses similar to these being shown.
The details that decide whether a backtest can be trusted.
- Tick replay
- No bar-close approximation. A stop and a target touched inside the same bar resolve in the order the market reached them.
- Book fills
- On ES, NQ, AAPL, MSFT and NVDA, market orders walk the recorded order book and limit orders wait their turn in the queue.
- Trade fills
- Everywhere else, and whenever you choose: fills at the printed trade price.
- Latency
- A fixed delay or a random range, so an order fills at the first price after it could have arrived.
- Costs
- Commission and margin profiles per instrument, applied to every fill.
- Sessions
- The exchange's own calendar and hours, with regular and extended sessions told apart.
Every trade, where it happened.
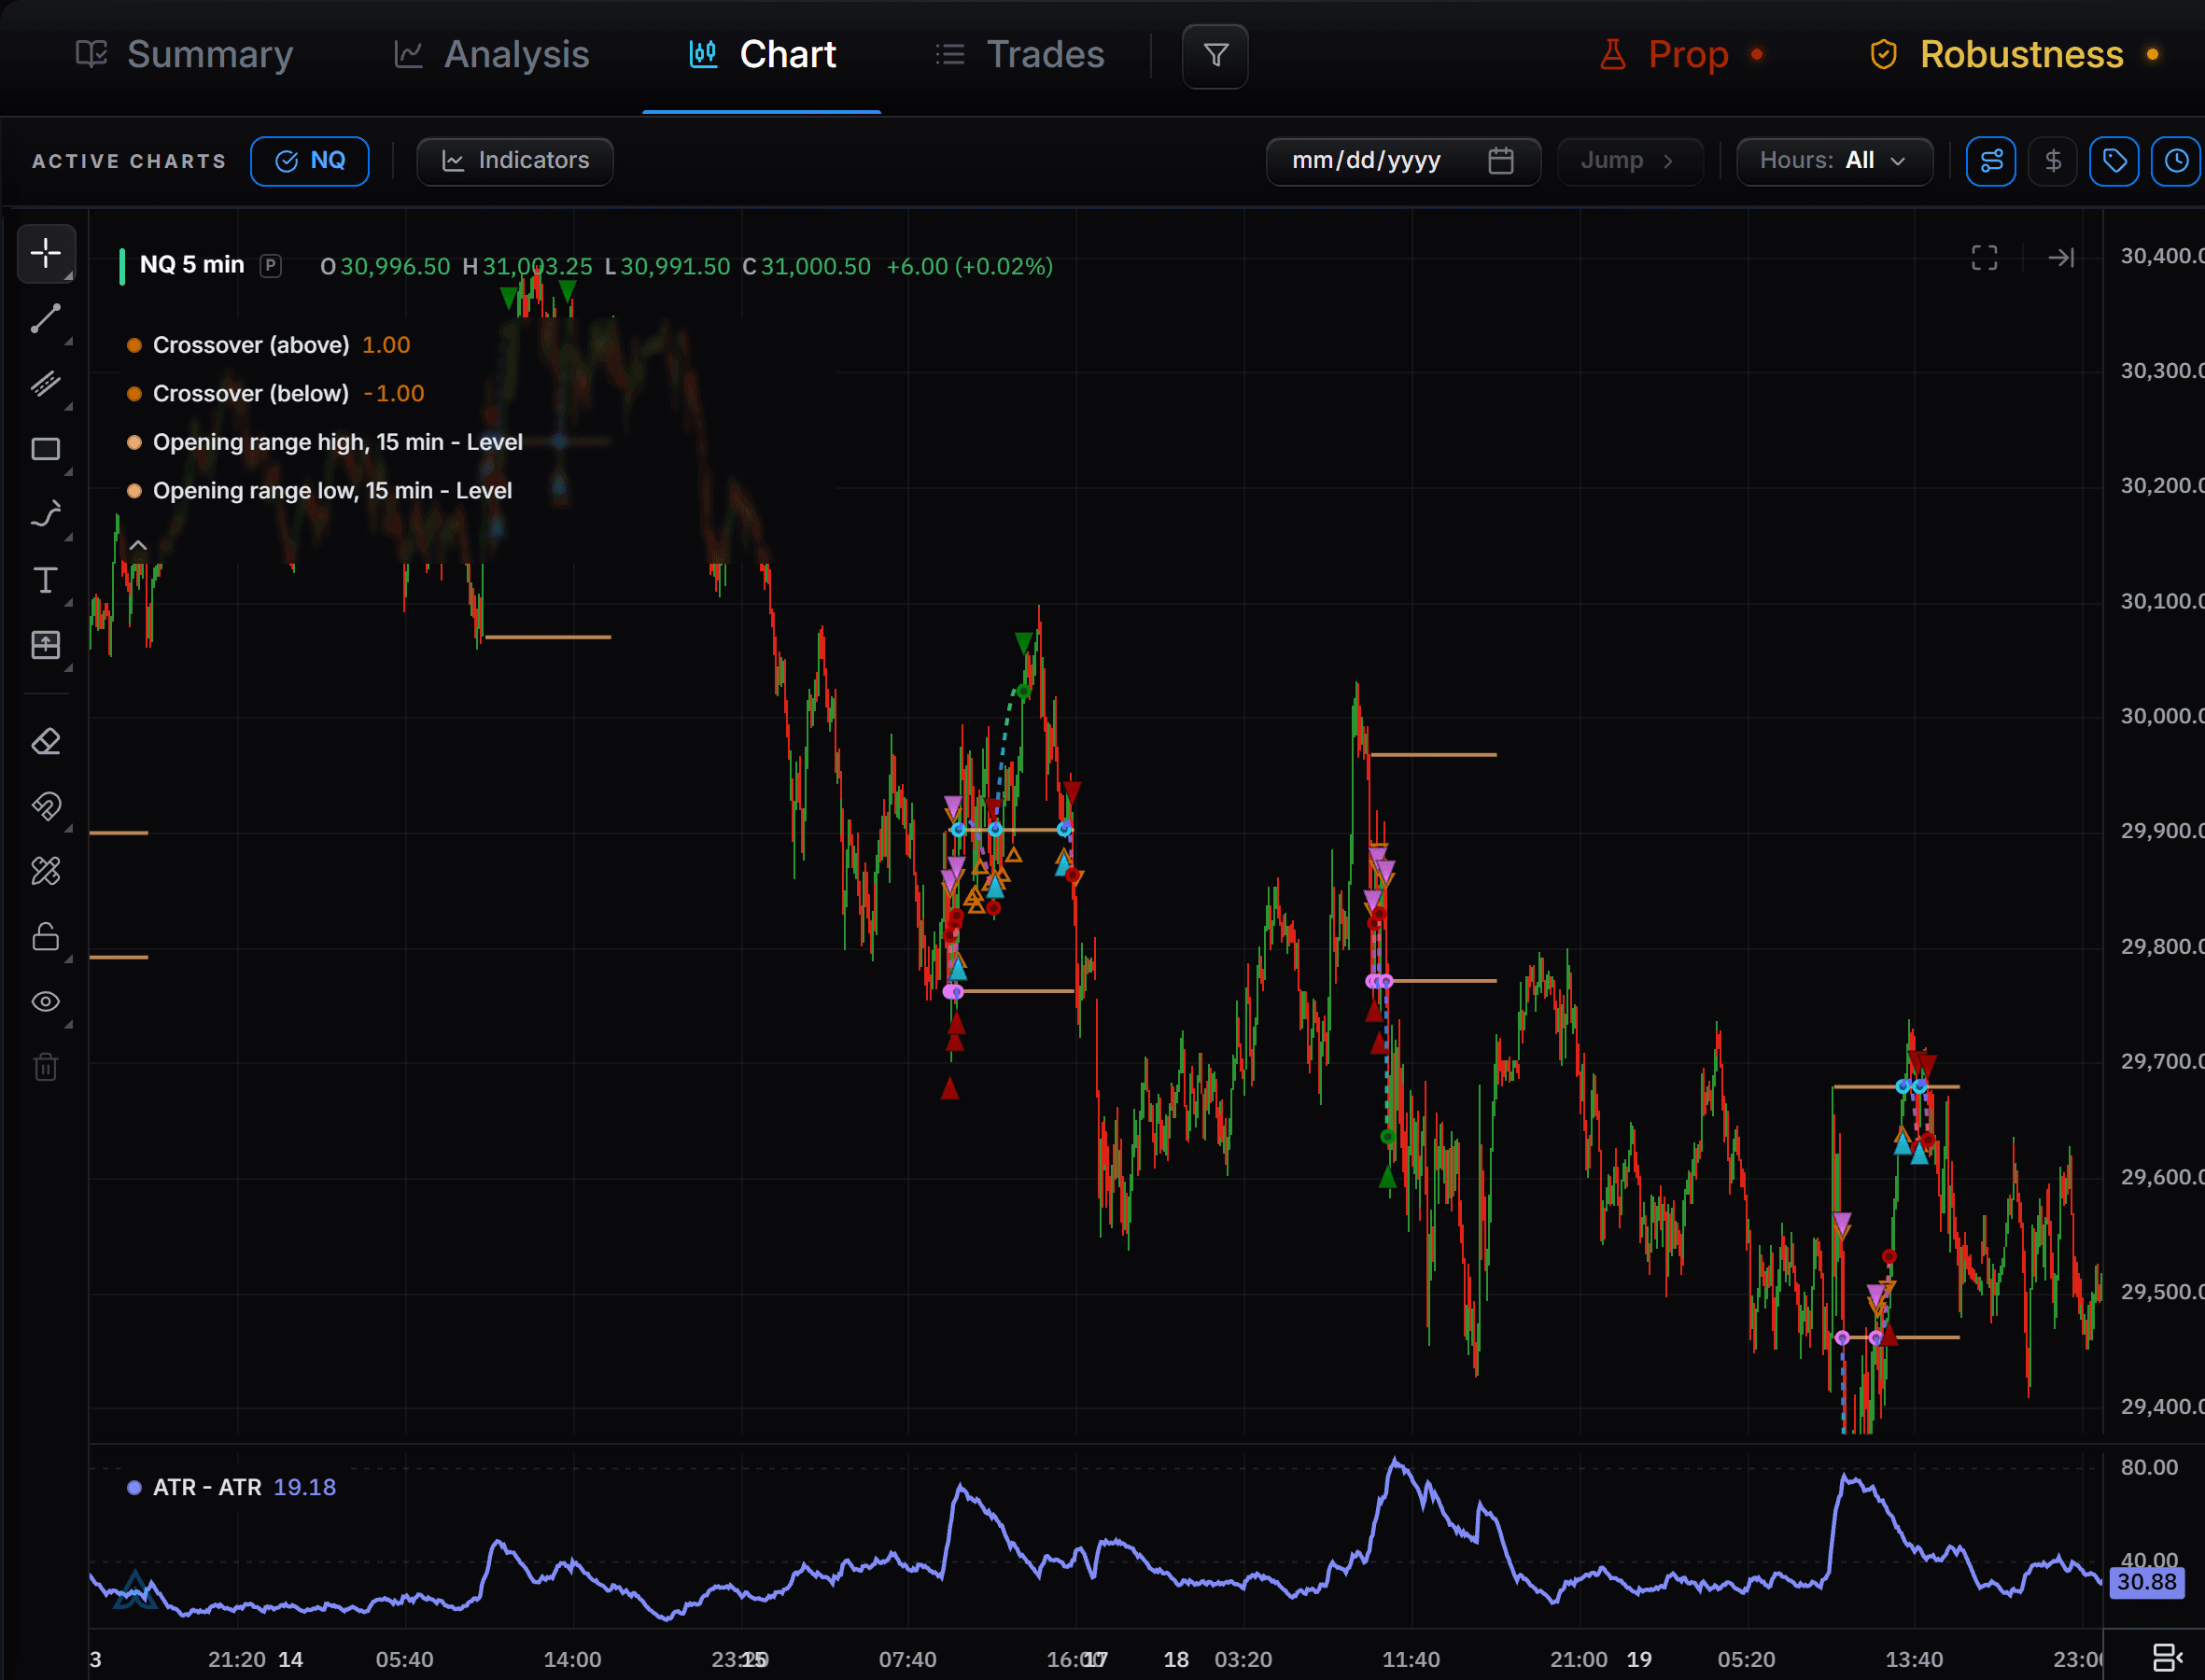
Results open on a full chart: every entry and exit on its bar, the strategy’s own levels and indicators drawn beside price, drawing tools and studies of your own on top.
Click any trade to see why it opened, how far it went for and against you, and why it closed.
Simulated results. They have inherent limitations. Read the full statementHide the statement
These results are based on simulated or hypothetical performance results that have certain inherent limitations. Unlike the results shown in an actual performance record, these results do not represent actual trading. Also, because these trades have not actually been executed, these results may have under-or over-compensated for the impact, if any, of certain market factors, such as lack of liquidity. Simulated or hypothetical trading programs in general are also subject to the fact that they are designed with the benefit of hindsight. No representation is being made that any account will or is likely to achieve profits or losses similar to these being shown.
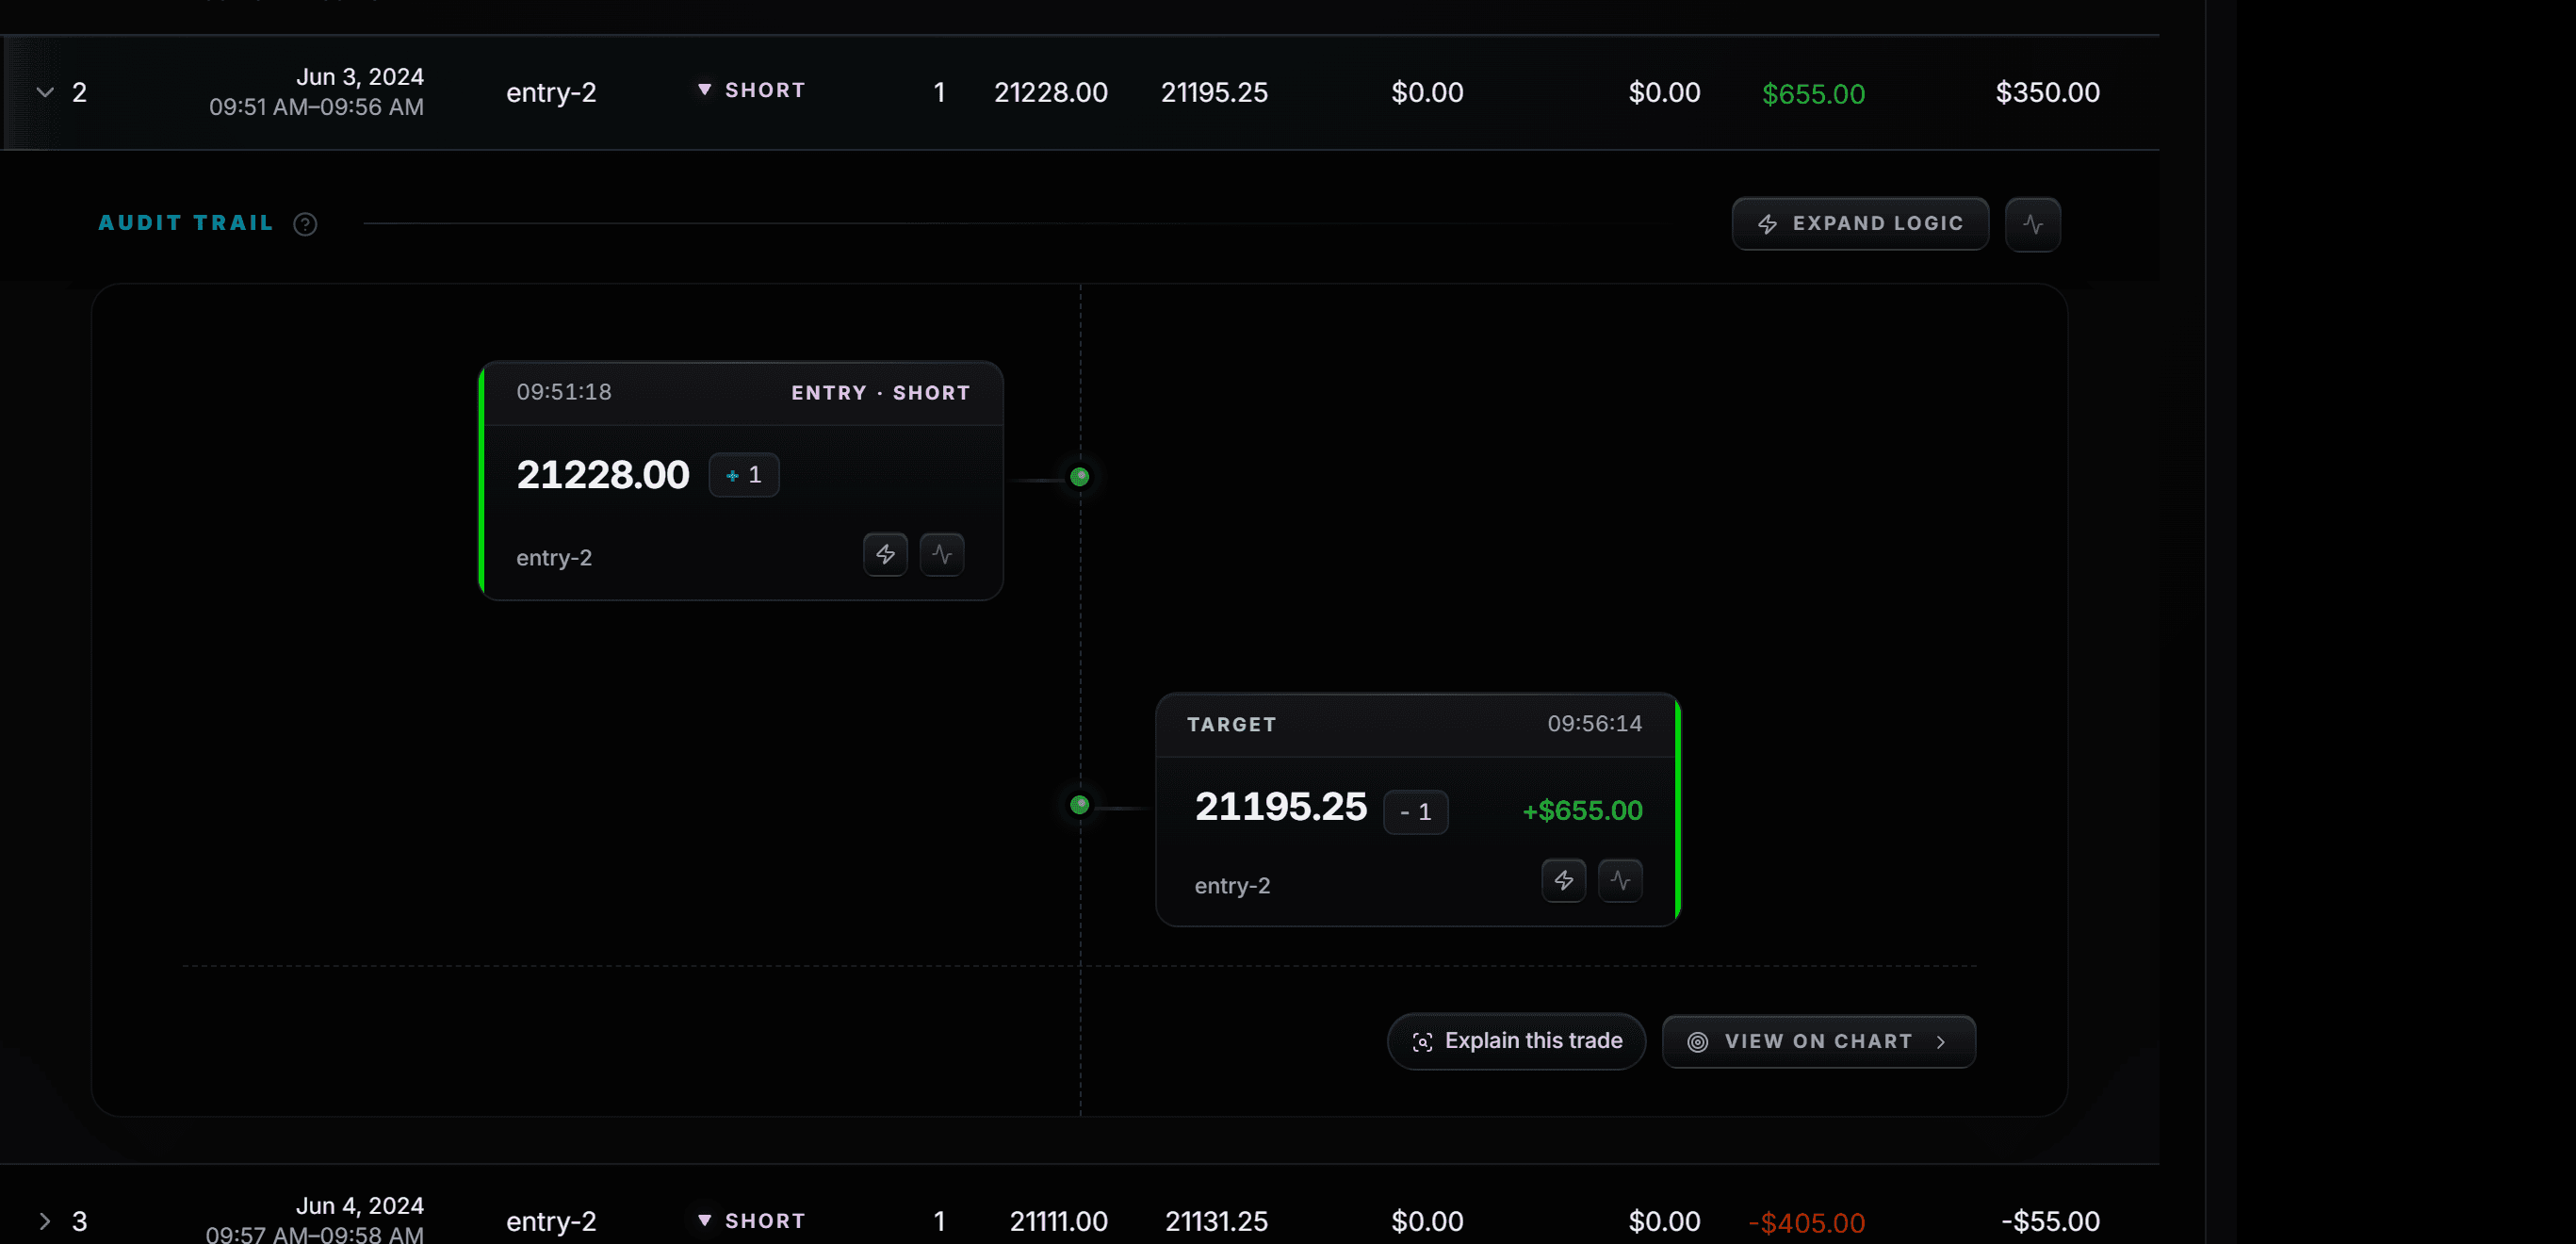
One trade, explained from entry to exit.
The trade panel shows the values each rule read when the trade opened, its best and worst point while it was open, and what closed it. When a run takes fewer trades than you expected, the debrief counts how often each signal fired and which rule held it back.
Simulated results. They have inherent limitations. Read the full statementHide the statement
These results are based on simulated or hypothetical performance results that have certain inherent limitations. Unlike the results shown in an actual performance record, these results do not represent actual trading. Also, because these trades have not actually been executed, these results may have under-or over-compensated for the impact, if any, of certain market factors, such as lack of liquidity. Simulated or hypothetical trading programs in general are also subject to the fact that they are designed with the benefit of hindsight. No representation is being made that any account will or is likely to achieve profits or losses similar to these being shown.
What you can test today.
- Futures
- E-mini S&P 500 and E-mini Nasdaq 100, from 2017.
- Stocks
- AAPL, MSFT and NVDA, from 2018.
- Crypto
- 20 Binance markets, 10 spot and 10 perpetual, from 2019.
- FX and metals
- EURUSD, GBPUSD, AUDUSD, NZDUSD, XAUUSD and XAGUSD, from 2019.
- Coming next
- More CME futures, the micros among them.