

Your backtest happened once. See 10,000 ways it could have gone.
A single history is one draw of luck. Robustness rebuilds your run thousands of times from its own trades, then asks what a skeptic would: whether the edge survives a different order, worse fills, bigger size and the bad streaks it has not met yet.
Simulated results. They have inherent limitations. Read the full statementHide the statement
These results are based on simulated or hypothetical performance results that have certain inherent limitations. Unlike the results shown in an actual performance record, these results do not represent actual trading. Also, because these trades have not actually been executed, these results may have under-or over-compensated for the impact, if any, of certain market factors, such as lack of liquidity. Simulated or hypothetical trading programs in general are also subject to the fact that they are designed with the benefit of hindsight. No representation is being made that any account will or is likely to achieve profits or losses similar to these being shown.
One sentence on what matters most, before any chart.
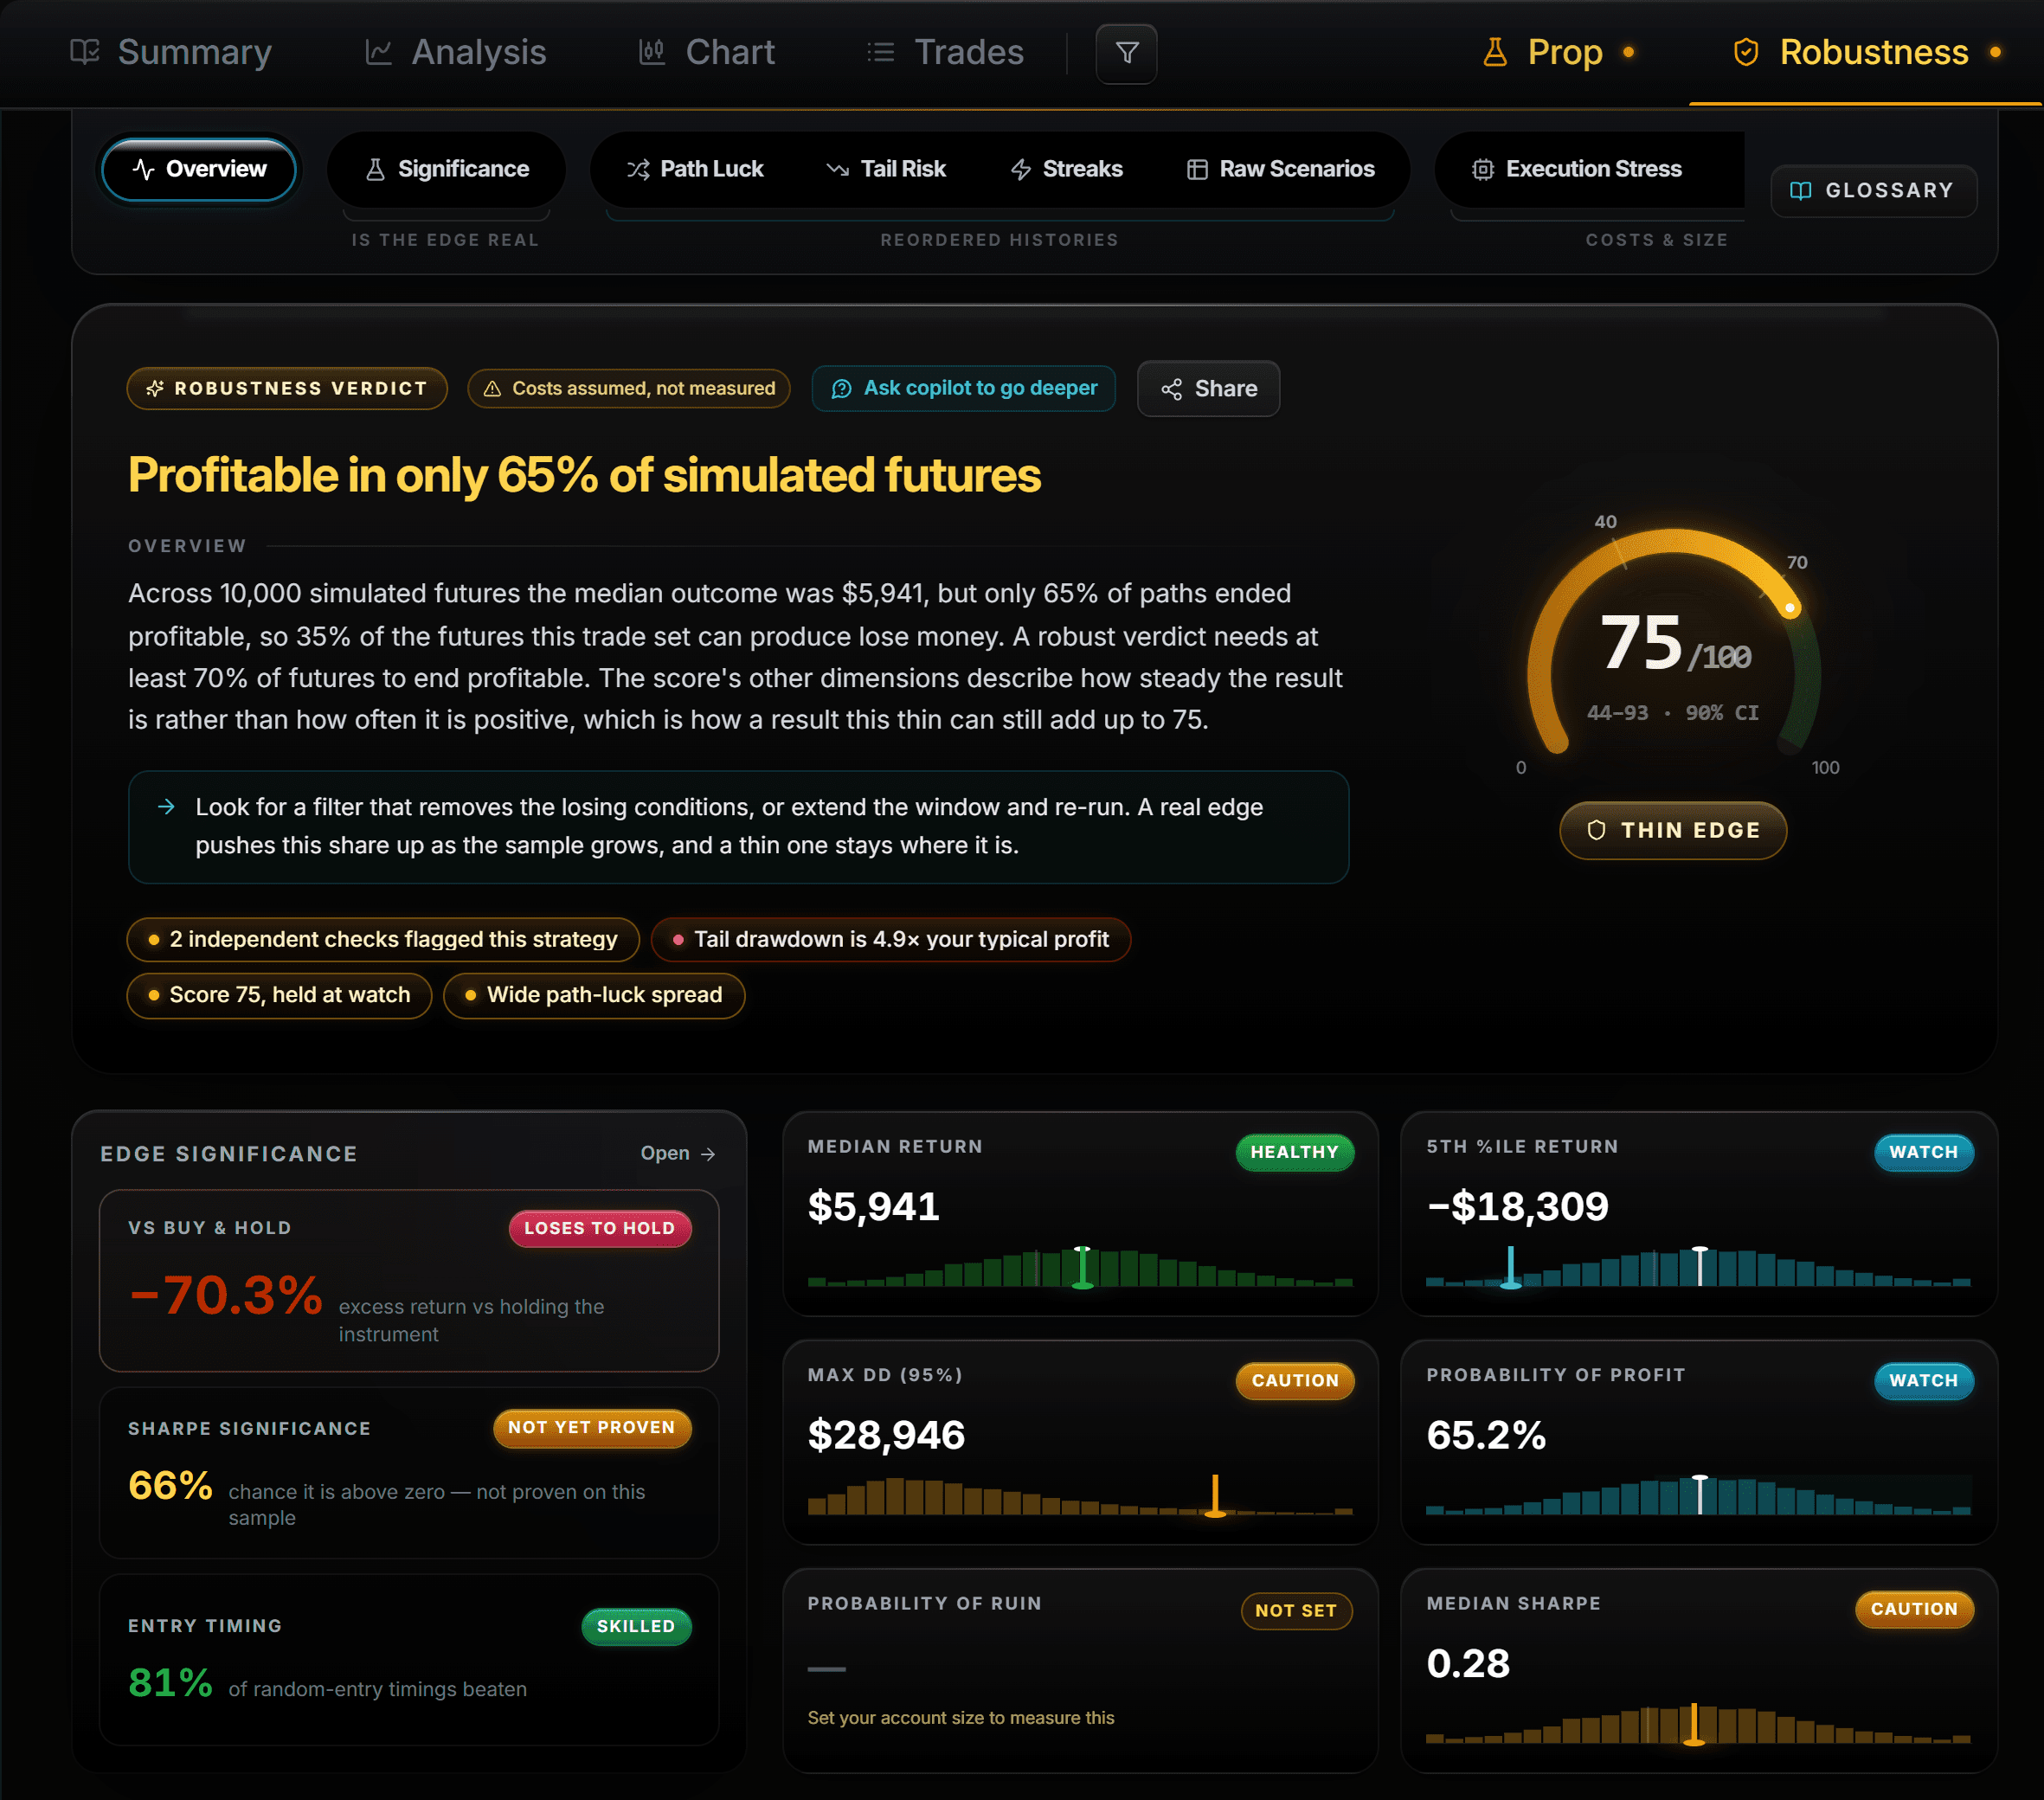
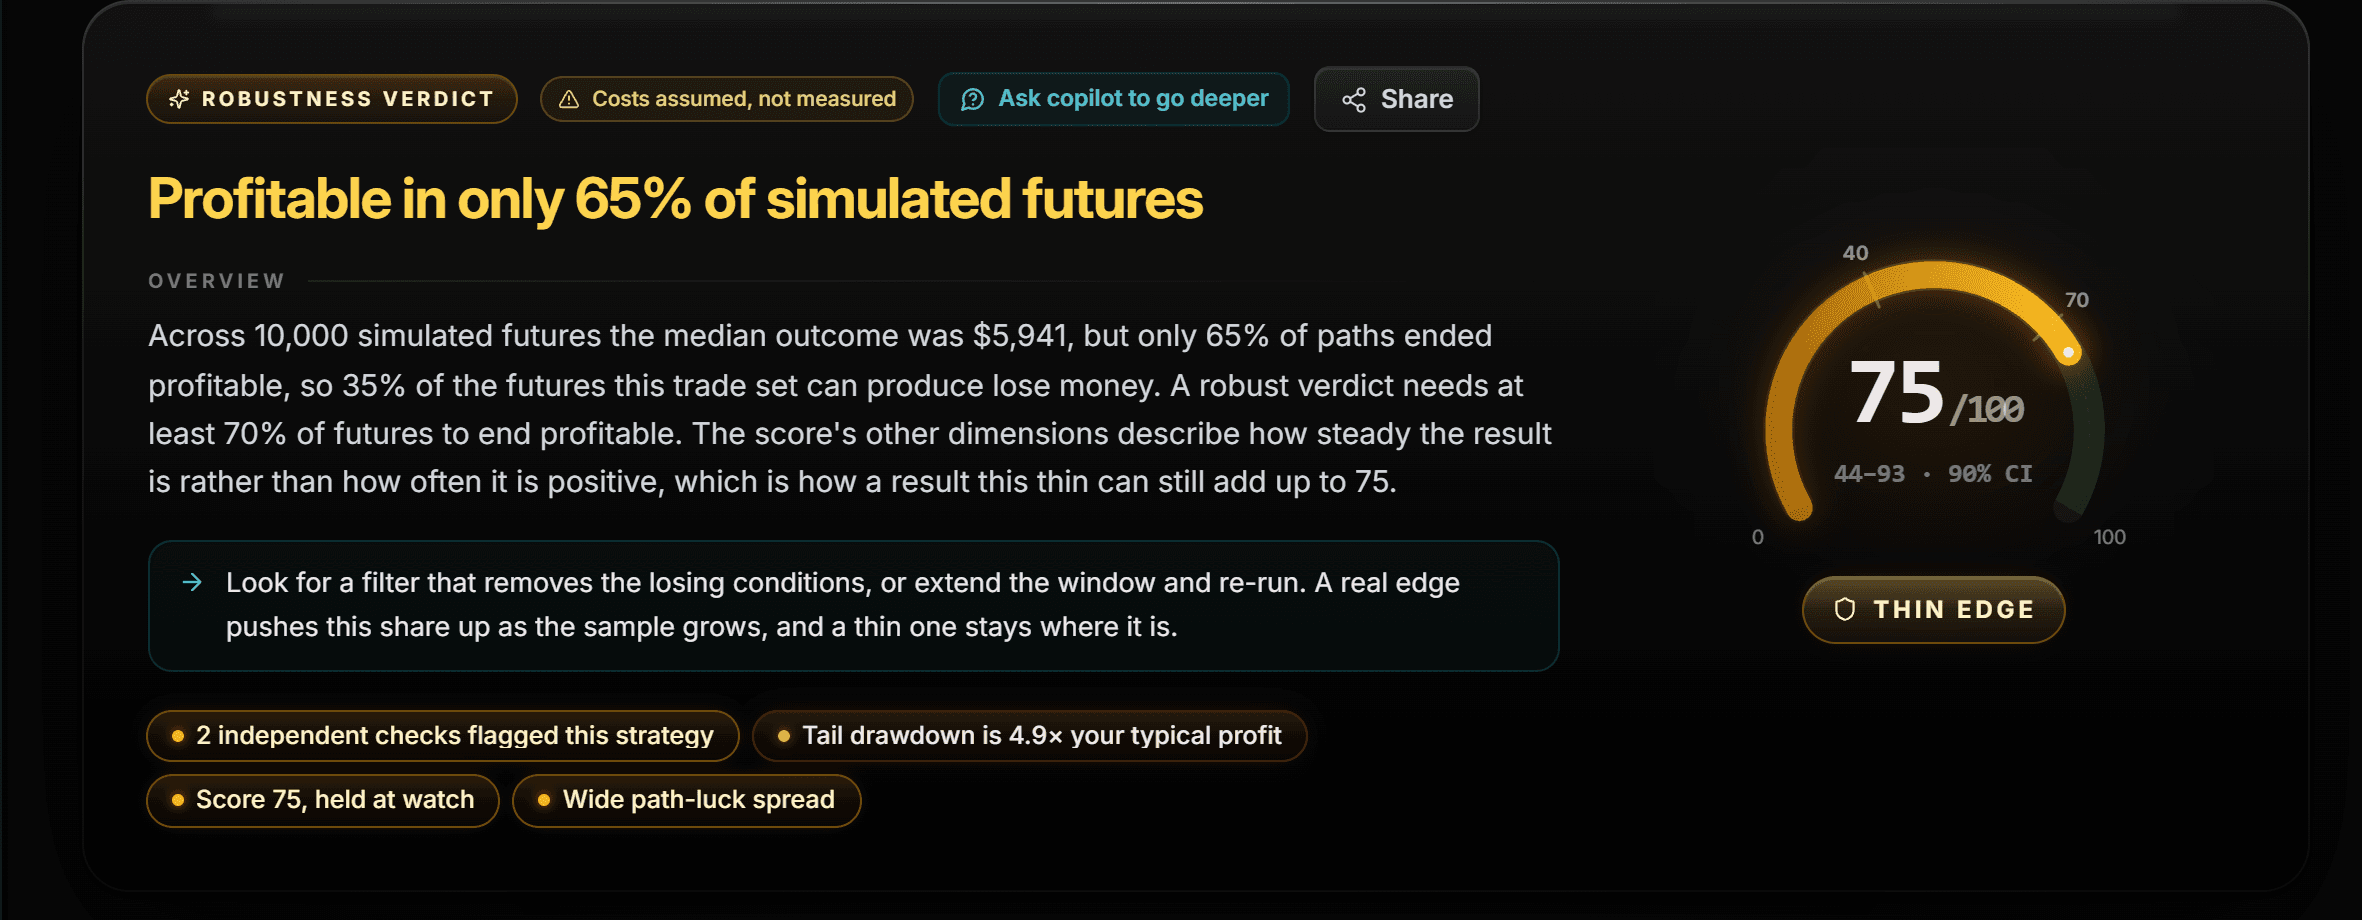
Every robustness read opens on its finding: whether there is an edge at all, whether a few lucky trades carry it, whether costs erase it, or whether it holds. The score and its parts sit under the finding, never in its place.
A strategy whose typical resampled future loses money reads fragile with its score withheld, and one that profits in fewer than seven of ten futures cannot be rated better than watch.
Simulated results. They have inherent limitations. Read the full statementHide the statement
These results are based on simulated or hypothetical performance results that have certain inherent limitations. Unlike the results shown in an actual performance record, these results do not represent actual trading. Also, because these trades have not actually been executed, these results may have under-or over-compensated for the impact, if any, of certain market factors, such as lack of liquidity. Simulated or hypothetical trading programs in general are also subject to the fact that they are designed with the benefit of hindsight. No representation is being made that any account will or is likely to achieve profits or losses similar to these being shown.
Eight ways to question one result.
- Overview
- The finding, the score and its five parts: path stability, tail discipline, edge concentration, regime breadth and sample-size confidence.
- Significance
- Whether the edge is distinguishable from chance on the same trades.
- Path luck
- Where your real run falls among the resampled ones, and how much of it was order.
- Tail risk
- The worst outcomes the resampling finds, and how deep they go.
- Execution stress
- Slippage and latency raised until the edge breaks, so you know the margin you have.
- Sizing
- How the outcome changes with position size, and where risk outgrows return.
- Streaks
- The losing runs to expect, so the first one does not surprise you.
- Raw scenarios
- Every resampled path, to inspect or export.
Honest about small samples.
A robust rating needs at least 100 trades, and below about 30 there is no rating at all, because a handful of trades cannot tell skill from luck. Each view says when the evidence is too thin, instead of drawing a confident chart over it.